Resources / GUIDES
E-Commerce Fit Analytics: Metrics That Matter
Five KPIs every fashion brand should track after implementing sizing technology. Adoption rate, fit-related returns, conversion lift, select-size rate, and repeat usage.
By Jenny, Co-founder · March 2026 · 6 min read
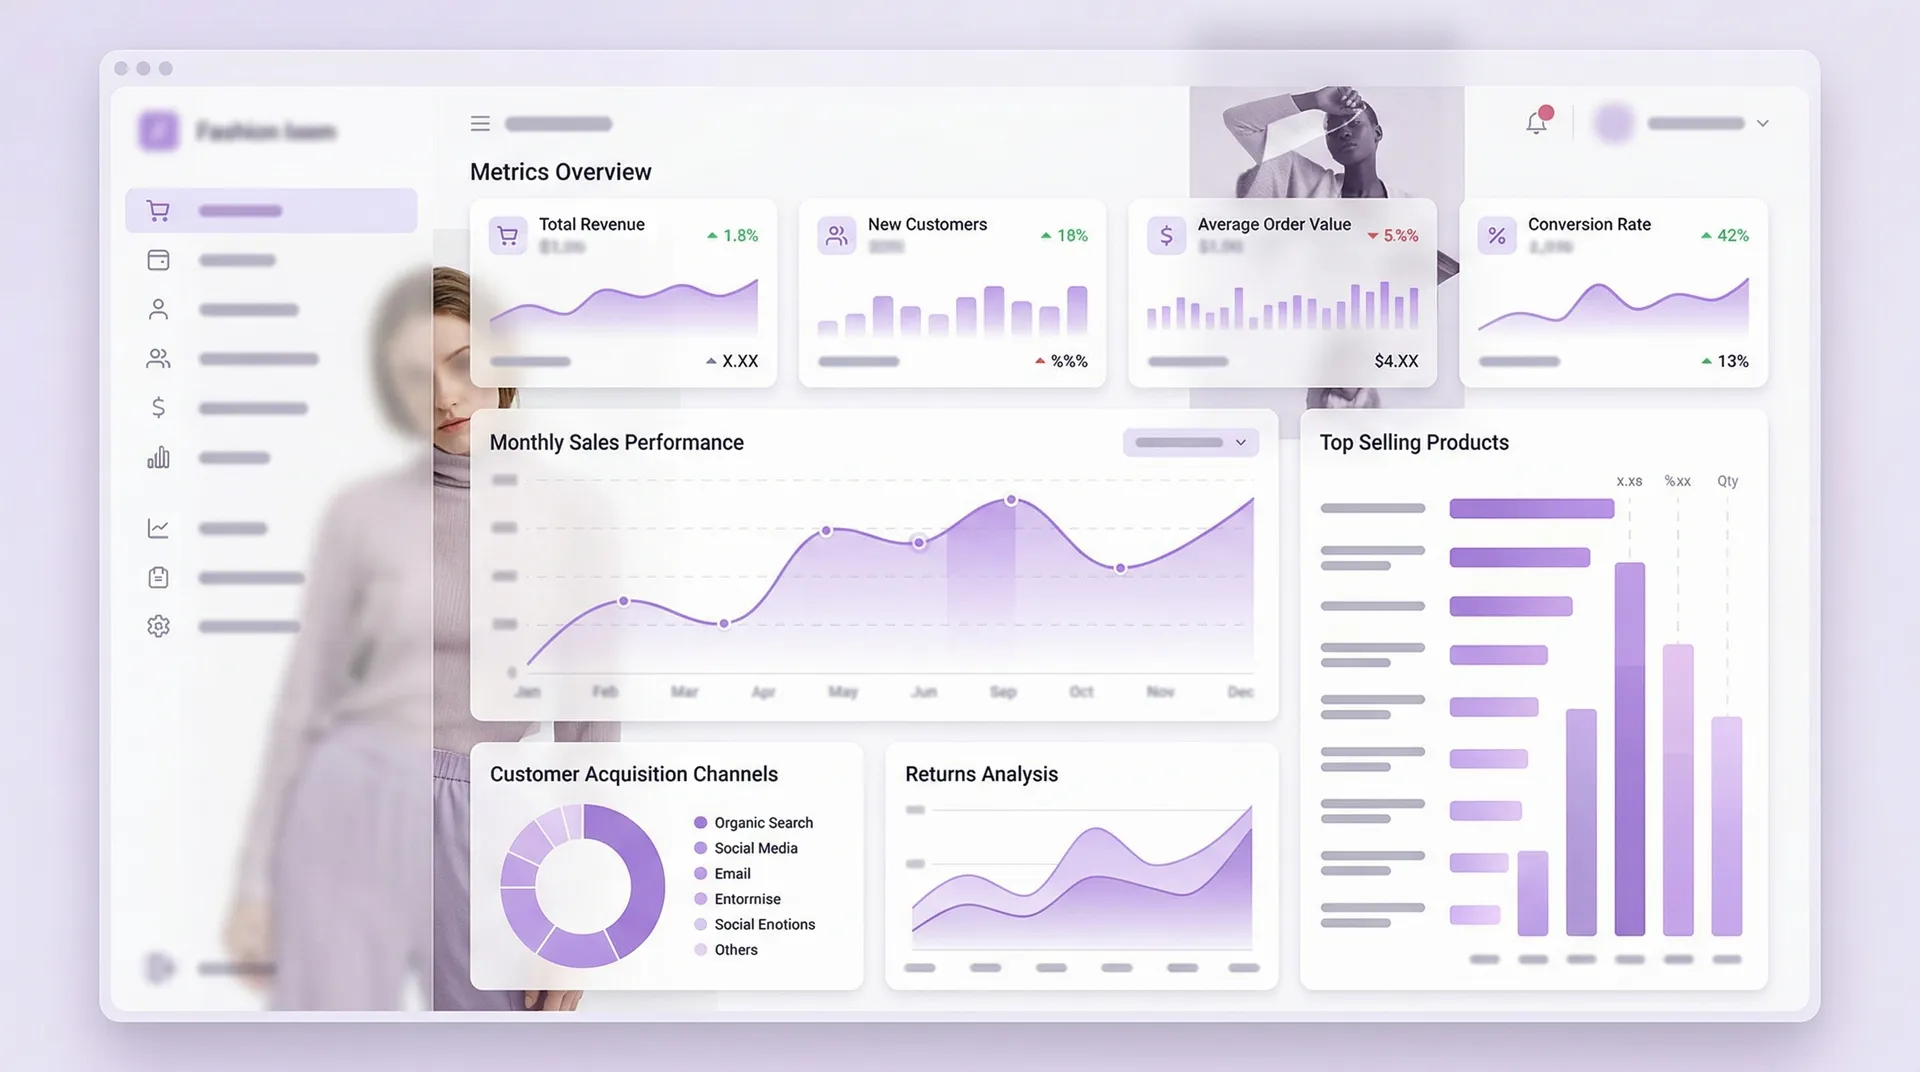
Installing a sizing tool is step one. The real value comes from measuring its impact and refining over time. Most brands focus on return rate as the only metric. That misses the full picture. Here are the KPIs that actually matter, how to track them, and what good looks like.
The Five KPIs That Matter
1. Adoption rate. What percentage of product page visitors engage with the sizing tool? If adoption is below 15 percent, the widget placement or design needs work. Shoppers are not finding it or not trusting it. Above 30 percent is strong.
2. Fit-related return rate. Track this separately from style returns, buyer remorse, and defects. Most brands lump all returns together, which makes it impossible to measure sizing impact. The Platform dashboard separates these automatically.
3. Conversion lift. Compare conversion rate for shoppers who use the sizing tool vs. those who do not. A healthy implementation shows 15 to 25 percent higher conversion among users. If the lift is below 10 percent, the recommendations may not be accurate enough or the experience may not be building sufficient confidence.
4. Select-size rate. What percentage of shoppers who receive a recommendation actually select that size? This measures trust. If shoppers see the recommendation but choose a different size anyway, the recommendation is not convincing them. Above 70 percent is the target.
5. Repeat profile usage. Do returning shoppers use their saved profile? If they create a profile once and never use it again, the experience did not deliver enough value to earn a second visit. A retention rate above 60 percent indicates the profile is genuinely useful.
Setting Up Measurement
The first 30 days after launch, run an A/B test: 50 percent of traffic sees the sizing tool, 50 percent sees your standard size chart. This gives you a clean baseline comparison. Track conversion, return rate, and average order value across both groups. Most brands see statistically significant results within two to four weeks.
What Good Results Look Like
After 90 days, expect: adoption rate above 20 percent, fit-related returns down 20 to 35 percent, conversion lift of 15 percent or higher among widget users, and a measurable increase in customer satisfaction scores. If any of these metrics are lagging, the issue is usually one of three things: widget placement (shoppers cannot find it), data quality (garment measurements are incomplete), or calibration (the model needs tuning to your brand's specific fit).
The Compounding Effect
The longer the system runs, the more data it collects, and the more accurate it becomes. Brands that treat fit analytics as an ongoing practice rather than a one-time measurement see compounding returns: accuracy improves, adoption grows as returning shoppers tell new ones, and the data feeds back into product development decisions.